Python plot generator
Here's a tiny code to help you if you want to generate graphs in python :
Then the picture generated :
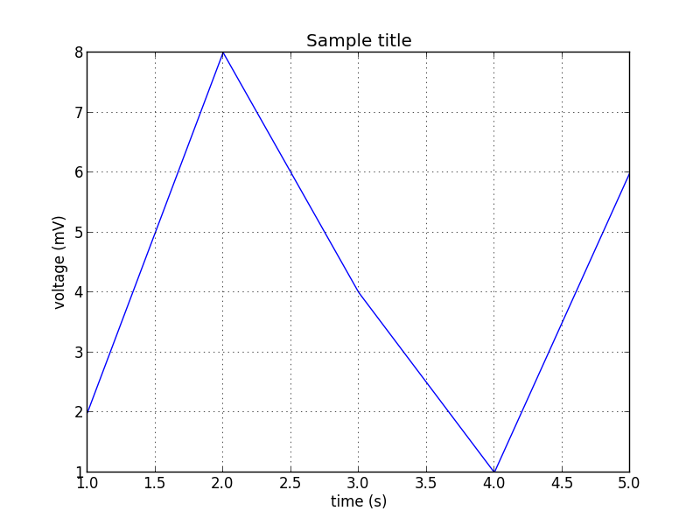
#!/usr/bin/env python

# We use pylab !
import pylab

# x axis values
t = [1, 2, 3, 4, 5]

# y axis values
s = [2, 8, 4, 1, 6]
pylab.plot(t, s)

pylab.xlabel('time (s)')
pylab.ylabel('voltage (mV)')
pylab.title('Sample title')
pylab.grid(True)

# export as a png file
pylab.savefig('python-plot')

pylab.show()
Then the picture generated :
Python tk live plot
Let's start another test with user interface (tk).
This is a bit kludgy that's true.
You need to write a buffer instead of using an export...
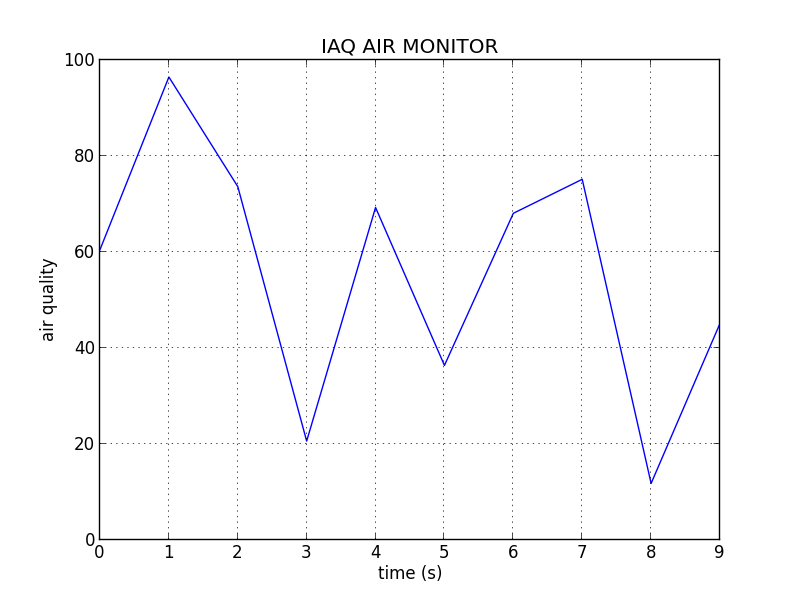
Here a kind of output that you can obtain (for real it's live chart not a picture) :
import time
import pylab
from Tkinter import *
from PIL import Image, ImageTk
import random

root = Tk()

# Consts
interface = 0
t = [0, 1, 2, 3, 4, 5, 6, 7, 8, 9]
v = [0, 50, 5, 10, 60, 75, 15, 22, 35, 45]

def export_plot(t, v):
  print t
  print v
  pylab.plot(t, v)
  pylab.xlabel('time (s)')
  pylab.ylabel('air quality')
  pylab.ylim([0,100])
  pylab.title('IAQ AIR MONITOR')
  pylab.grid(True)
  pylab.savefig('plot')
  pylab.show()
  pylab.close()

def update_img():
  img = ImageTk.PhotoImage(Image.open('plot.png'))
  try:
    if root.img_label.winfo_ismapped():
      root.img_label.pack_forget()
  except:
    pass
  root.img_label = Label(root, image=img)
  root.img_label.img = img
  root.img_label.pack()
  root.update()

dev = None

def get_values():
  root.after(1000, get_values)
  val = random.random() * 100
  v.pop(0)
  v.append(val)
  export_plot(t, v)
  update_img()
  time.sleep(1)

get_values()
root.mainloop()
This is a bit kludgy that's true.
You need to write a buffer instead of using an export...
Here a kind of output that you can obtain (for real it's live chart not a picture) :