Generate a line plot with GNUplot
Let's start with a line plot :
Assuming you put this kind of data in plot.dat (use pwd in GNUplot to see where to put this file).
You will get :
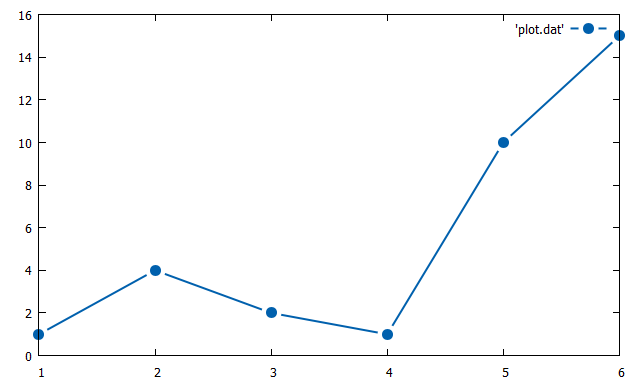
set style line 1 lc rgb '#0060ad' lt 1 lw 2 pt 7 pi -1 ps 1.5
set pointintervalbox 2
plot 'plot.dat' with linespoints ls 1
Assuming you put this kind of data in plot.dat (use pwd in GNUplot to see where to put this file).
# plotting_data1.dat
# X   Y
  1   1
  2   4
  3   2
  4   1
  5   10
  6   15
You will get :
GNUplot line cos plot
Let's start another test with cosinus.
We keep style and line (between points).
This simply print cos values with default sample rate.
Who tells GNUplot is hard to use?
Let's see the result :
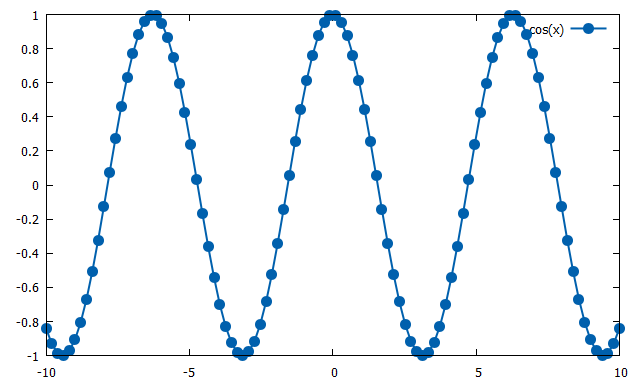
We keep style and line (between points).
set style line 1 lc rgb '#0060ad' lt 1 lw 2 pt 7 pi -1 ps 1.5
set pointintervalbox 0
plot cos(x) with linespoints ls 1
This simply print cos values with default sample rate.
Who tells GNUplot is hard to use?
Let's see the result :
C code creates a graph automatically using GNUplot
To have a window which opens when you launch the C programs you need to install gnuplot-x11 (or some other gnuplot ui).
Thanks to Maberib for this post.
This will print your plot into gnuplot user interface.
See what we get :
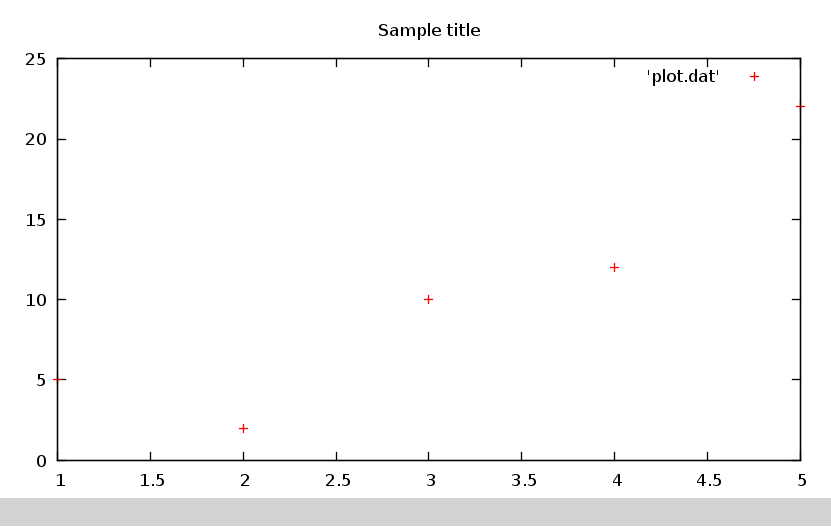
Thanks to Maberib for this post.
#include#include #define NUM_POINTS 5 #define NUM_COMMANDS 2 int main() { char * commandsForGnuplot[] = {"set title 'Sample title'", "plot 'plot.dat'"}; double xvals[NUM_POINTS] = {1.0, 2.0, 3.0, 4.0, 5.0}; double yvals[NUM_POINTS] = {5.0 ,3.0, 10.0, 3.0, 22.0}; FILE * temp = fopen("plot.dat", "w"); FILE * gnuplotPipe = popen ("gnuplot -persistent", "w"); int i; for (i=0; i < NUM_POINTS; i++) { fprintf(temp, "%lf %lf \n", xvals[i], yvals[i]); } for (i=0; i < NUM_COMMANDS; i++) { fprintf(gnuplotPipe, "%s \n", commandsForGnuplot[i]); } return 0; }
This will print your plot into gnuplot user interface.
See what we get :